
In today’s fast-paced digital landscape, page speed plays a crucial role in your user experience and business success. Ensuring that your website loads quickly is not only essential for retaining visitors but also for improving your search engine rankings.
But how can you evaluate your website’s performance and identify areas for improvement? That’s where page speed testing tools can help. In this post, we’ll introduce you to eight awesome page speed-testing tools that are perfect for website owners or marketing managers. Discover how these tools can help you measure and optimise your website’s page speed, leading to enhanced user satisfaction, increased conversions, and a competitive edge in the online marketplace.
Before you choose a Page Speed Testing Tool, you’ll need to understand some of the technical principles of page speed and the language used. Here’s a quick overview of the terminology and acronyms you’re likely to come across, what they mean and why they’re important.
Page Speed Terminology Explained
Page Speed Measurement
- CLS – Cumulative Layout Shift: A measure of visual stability that measures how much a web page’s layout shifts during loading.
- DOM Size: The size of a web page’s Document Object Model (DOM), which is a tree-like structure that represents the content of a web page in the browser’s memory and includes all of the HTML elements.
- FID – First Input Delay: A measure of interactivity that measures the time it takes for a web page to respond to a user’s first input.
- LCP – Largest Contentful Paint: A measure of perceived load speed that measures the time it takes for the largest element on a web page to load.
- Page Speed Score: A score (usually out of 100) that represents a website’s performance in terms of page speed.
- Page Weight: The total size of a web page, including all resources (like HTML, CSS, JavaScript, and images).
- Server Response Time: The amount of time it takes for a server to respond to a request from a user’s browser.
- TBT – Total Blocking Time: A metric used to measure the interactivity of a web page. Specifically, TBT measures the amount of time between when a user interacts with a web page (such as clicking a button or scrolling), and when the page becomes responsive to that interaction.
- TTI – Time To Interactive: The amount of time it takes for a web page to become fully interactive and responsive to user input.
- TTFB – Time To First Byte: The amount of time it takes for a user’s browser to receive the first byte of data from a server.
Networking
- CDN – Content Delivery Network: A network of servers that helps deliver web content more efficiently by caching content and delivering it from a server closest to the user’s location.
- DNS – Domain Name System: A system that translates domain names into IP addresses.
- Request: A call made by a browser or CDN to fetch a resource (like a file or image) from a server.
- SSL – Secure Sockets Layer: A protocol used to encrypt data sent between a user’s browser and a web server. Further reading: SSL Impact on Page Speed Explained
Page Content
- CSS – Cascading Style Sheets: A language used to describe the visual style of a web page. Further reading: CSS Minification
- DCL – DOM Content Loaded: An event in the browser’s loading process that is triggered when the HTML of a web page has been completely parsed and the DOM is fully constructed. It indicates that the page’s HTML is ready to be manipulated by JavaScript code.
- HTML – Hypertext Markup Language: A markup language used to create web pages. Learn more: HTML Minification
- HTTP – Hypertext Transfer Protocol: A protocol used to transfer data over the internet.
- HTTPS – Hypertext Transfer Protocol Secure: A protocol used to transfer data over the internet securely, using SSL encryption.
- JS – JavaScript: A programming language used to create interactive elements on a web page. Learn more about Javascript Minification.
- Legacy JavaScript: Older or outdated JavaScript code that may no longer be optimised for modern web browsers or devices. Legacy JavaScript can slow down page speed and impact the user experience, and is often replaced or updated to improve performance. Learn How to Fix Legacy JavaScript and Increase Page Speed
- Network Payload: The amount of data that needs to be downloaded from the server to display a web page, including all resources like HTML, CSS, JavaScript, and images. Reducing the network payload can help speed up page load times and improve the user experience. Learn How to Fix Large Network Payload and Improve Page Speed
- Next-Gen Image Formats: Image formats that are optimised for web use and offer improved compression and performance compared to traditional formats like JPEG or PNG. Popular next-gen image formats include WebP and AVIF, which can help improve page speed and reduce network payload. Learn How to Optimise Images to Increase Page Speed
Techniques and Tools
- Cache: A temporary storage area that stores frequently-accessed data, like web content or browser data, to reduce page load times. See How to Use Caching to Optimise Page Speed
- Cache Control: A header that controls how long a resource is cached by a browser or CDN. See How Cache Control Improves Page Speed
- Expires Header: A header that specifies when a cached resource should expire and be updated.
- See: How to Use Expires Header to Improve Page Speed
- GZIP – A compression method used to reduce the size of files sent over the internet, such as HTML, CSS, and JavaScript files. Learn How to Use GZIP Page Compression to Improve Page Speed.
- Image Compression: The process of reducing the file size of images without significantly impacting image quality. Related: 10 Tools for Compressing and Optimising Web Page Images.
- Keep-Alive: A protocol that allows a browser to reuse an existing connection to a server instead of opening a new one each time a request is made. Keep-alive can help improve page speed by reducing the number of connections needed to download resources. Learn How to Use Keep-Alive to Improve Page Speed.
- Lazy Loading: A technique that delays the loading of non-critical resources (like images) until they are needed, which can speed up page load times. Understand Lazy Loading and How it Works.
- Minification: The process of reducing the size of code (like HTML, CSS, or JavaScript) by removing unnecessary characters, like whitespace or comments. See Page Speed: Minification of Code
- Preloading: A technique that allows web developers to tell a browser or CDN to fetch resources (like images or JavaScript files) before they are needed, which can speed up page load times. Learn about Preloading Key Requests to Improve Page Speed
- Resource Hints: A technique that allows web developers to provide hints to a browser or CDN about resources that will be needed in the future, which can speed up page load times. Read Resource Hints Explained
- Text Compression: A technique used to compress text-based resources (like HTML, CSS, or JavaScript files) to reduce their size and speed up page load times. Popular text compression methods include GZIP and Brotli. Learn more about Enabling Text Compression to Improve Page Speed
Other Terminology
- Above-the-Fold Content: The portion of a web page that is visible without scrolling, which is often prioritised for optimisation to improve perceived page speed.
- Critical Rendering Path: The sequence of resources (like HTML, CSS, and JavaScript files) that are necessary for rendering a web page.
- Main Thread Work: The amount of work that needs to be done on the main thread of a web page, which can impact page speed and interactivity. To improve performance, web developers may use techniques like code splitting, lazy loading, or optimising JavaScript to reduce main thread work. Understand Reducing Main Thread Work to Improve Page Speed
- Render-Blocking Resources: Resources (like CSS or JavaScript files) that prevent a web page from rendering until they have fully loaded, which can slow down page speed. See How to Optimise Render-Blocking Resources and Improve Page Speed
Page Speed Testing Tools
1. Google Pagespeed Insights

This is a free tool that analyses the performance of a web page on both mobile and desktop devices, and provides suggestions for optimisation.
Price: Free
User level: Web Admin
Features of Google Page Speed Insights include:
Web Page Speed analysis: Page Speed Insights measures how long it takes for a website to load and identifies issues that could be slowing it down, such as large image files or too much JavaScript code.
Mobile-friendliness analysis: Page Speed Insights checks how well a website works on mobile devices and provides recommendations for improving its mobile performance.
User experience analysis: Page Speed Insights looks at a website’s design and layout, including font size, button placement, and other elements that can affect the user experience, and provides suggestions for improving it.
Suggestions for improvement: Based on its analysis, Page Speed Insights provides specific suggestions for how to improve a website’s performance, including things like optimising images, reducing the amount of code on a page, and using caching to speed up loading times.
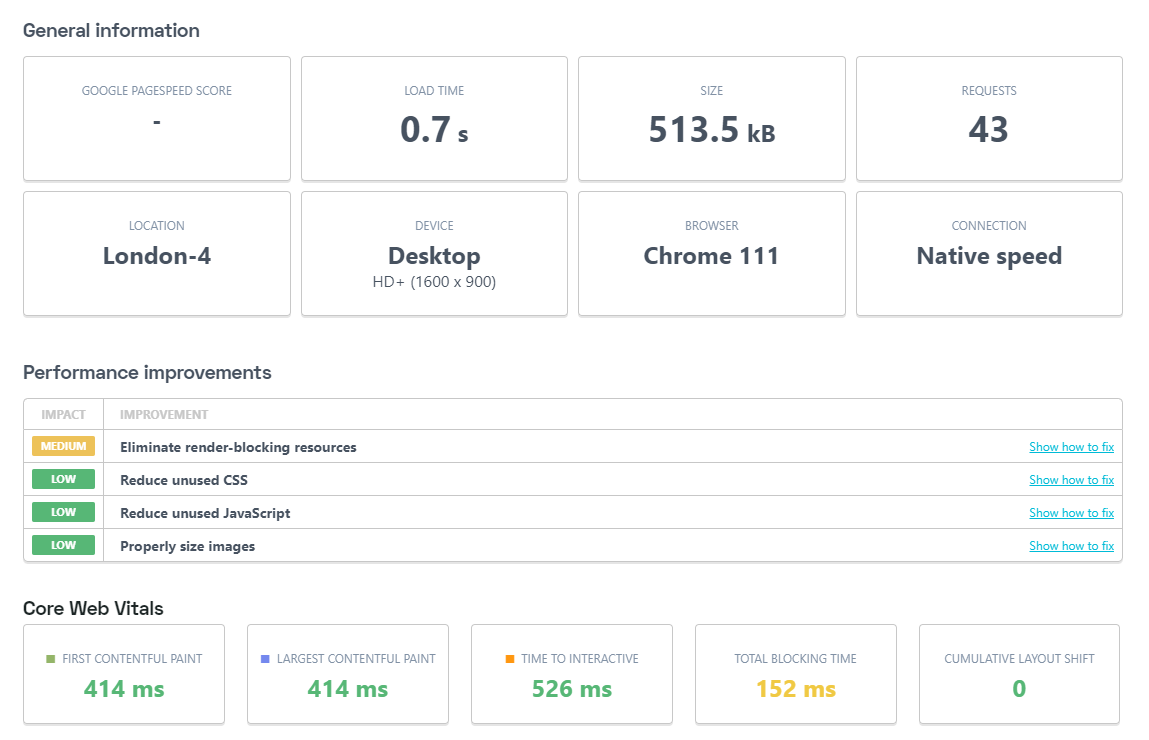
2. GTmetrix
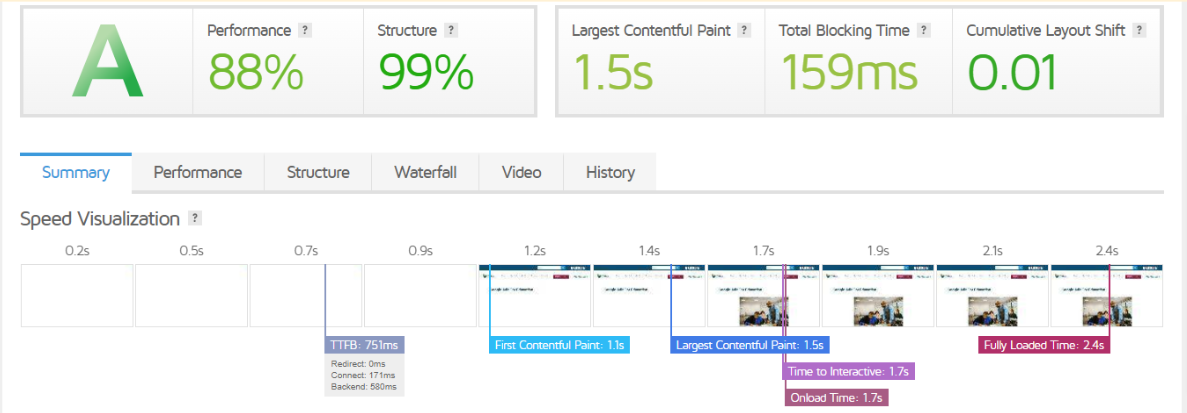
GTmetrix is a free tool that analyses the performance of a web page and provides detailed recommendations for optimisation.
Price: Free with limitations, plus monthly price plans for pro use and monitoring
User level: Web Admin / Developer
Features of GTMetrix include:
Page Speed Analysis: GTMetrix analyses the speed and performance of a website, providing a comprehensive report on various aspects that impact loading times such as page size, request count, and server response time.
YSlow Analysis: GTMetrix provides a YSlow analysis, which is a tool that evaluates the performance of web pages and offers suggestions for improvement.
Waterfall Chart: The Waterfall chart in GTMetrix shows the loading sequence of all the resources required to load a web page, including the time it takes to load each element.
Video Capture: GTMetrix captures a video of the website as it loads, allowing users to see how the website appears during the loading process.
Performance Report: GTMetrix generates a performance report that includes detailed information on a website’s speed and performance, along with suggestions for improvement.
Historical Monitoring: GTMetrix allows users to track their website’s performance over time, providing insight into how it’s performing and where improvements are needed.
Compare Reports: GTMetrix allows users to compare performance reports for different versions of their website or different websites altogether, making it easy to identify areas for improvement.
3. Pingdom
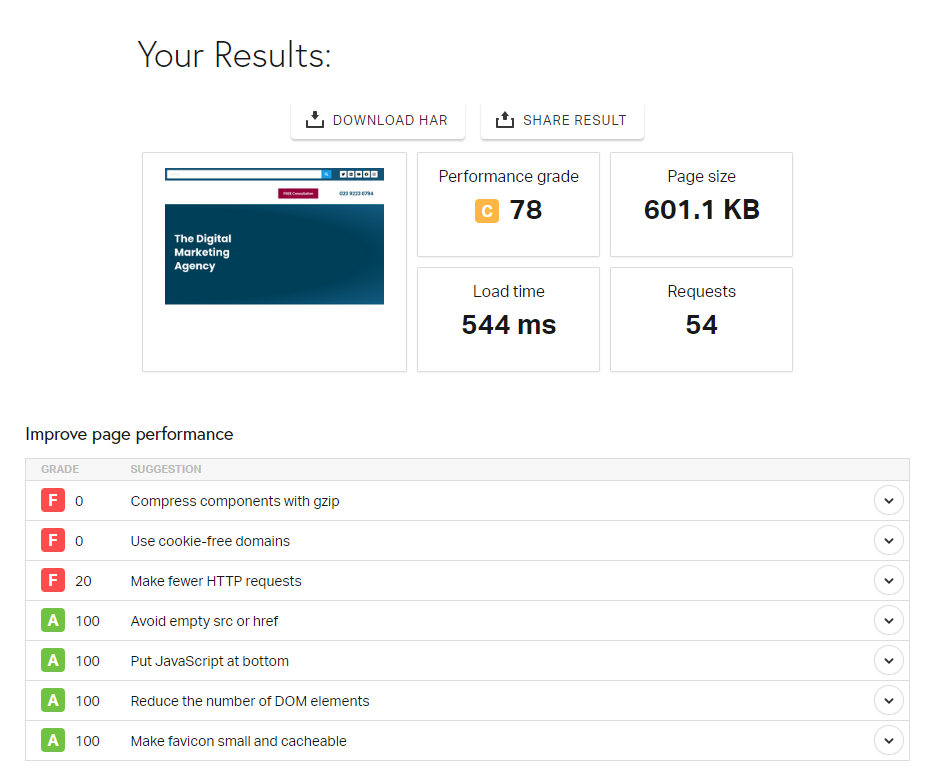
Pingdom is a paid tool that provides website performance monitoring, uptime monitoring, and website speed testing.
Price: From <£10/month
User level: Web Admin
Features of Pingdom include:
Website Speed Test: Pingdom’s speed test analyses the load time of your website and provides a detailed breakdown of the different components of your page.
Real User Monitoring (RUM): RUM tracks the performance of your website from the perspective of actual users, providing insights into their experience and identifying areas for improvement.
Synthetic Monitoring: Pingdom’s synthetic monitoring checks your website’s uptime and performance from multiple locations around the world, giving you a comprehensive view of your website’s availability and speed.
Page Speed Monitoring: Pingdom’s page speed monitoring tracks the performance of individual pages on your website, helping you identify specific issues that are impacting your site’s speed.
Transaction Monitoring: Transaction monitoring simulates user interactions with your website, allowing you to identify performance issues in critical user flows such as checkout and registration.
Alerts: Pingdom’s alerts notify you when your website’s speed or uptime falls below predefined thresholds, allowing you to quickly address any issues and minimise the impact on your users.
Reports: Pingdom’s reports provide in-depth analysis of your website’s performance, allowing you to track trends over time and identify areas for improvement.
4. WebPageTest
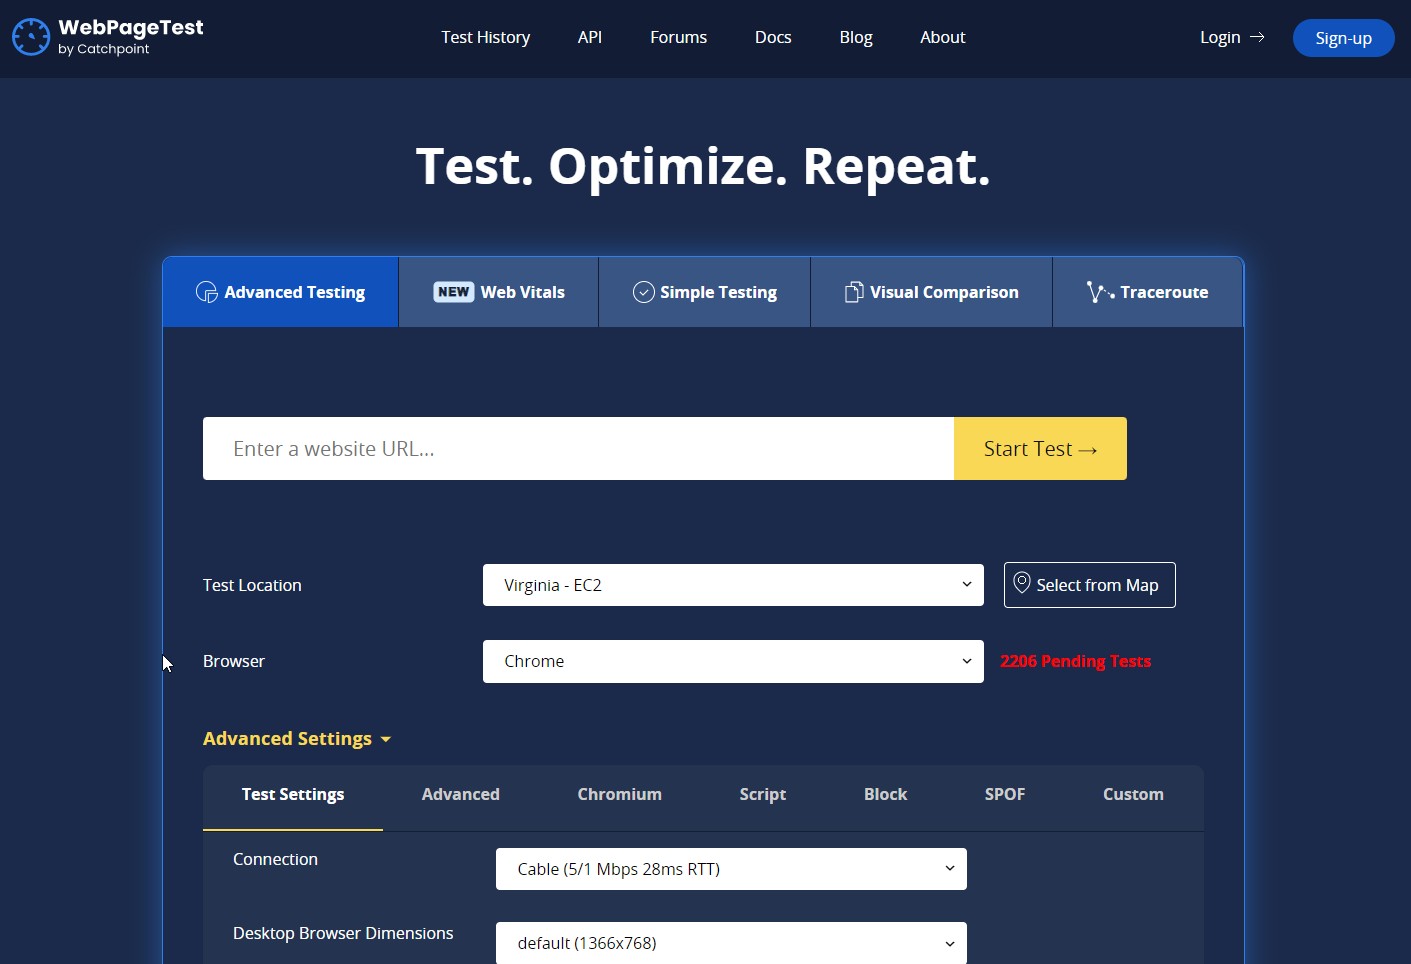
WebPageTest is a free tool that provides advanced testing and analysis options, including the ability to test from multiple locations.
Price: Free plan, plus paid for higher usage
User level: Web Admin, Developer
WebPageTest Features include:
Multi-location testing: WebPageTest allows you to test your website’s performance from multiple locations around the world, so you can see how it performs for users in different regions.
Browser-based testing: You can choose from a range of browsers to run your tests on, including Chrome, Firefox, Safari, and Internet Explorer.
Performance metrics: WebPageTest provides a range of performance metrics to help you understand how your website is performing, including load time, time to first byte, and speed index.
Waterfall charts: You can view a waterfall chart of your website’s load times, which shows you the load time for each individual resource on your page.
Video capture: WebPageTest can capture a video of your website as it loads, which can help you identify performance issues and user experience problems.
Custom scripting: You can create custom scripts to test specific user flows on your website, such as logging in or making a purchase.
Advanced settings: WebPageTest also provides a range of advanced settings for customising your tests, including network throttling, user agent switching, and ad blocking.
5. Pagespeed.compare
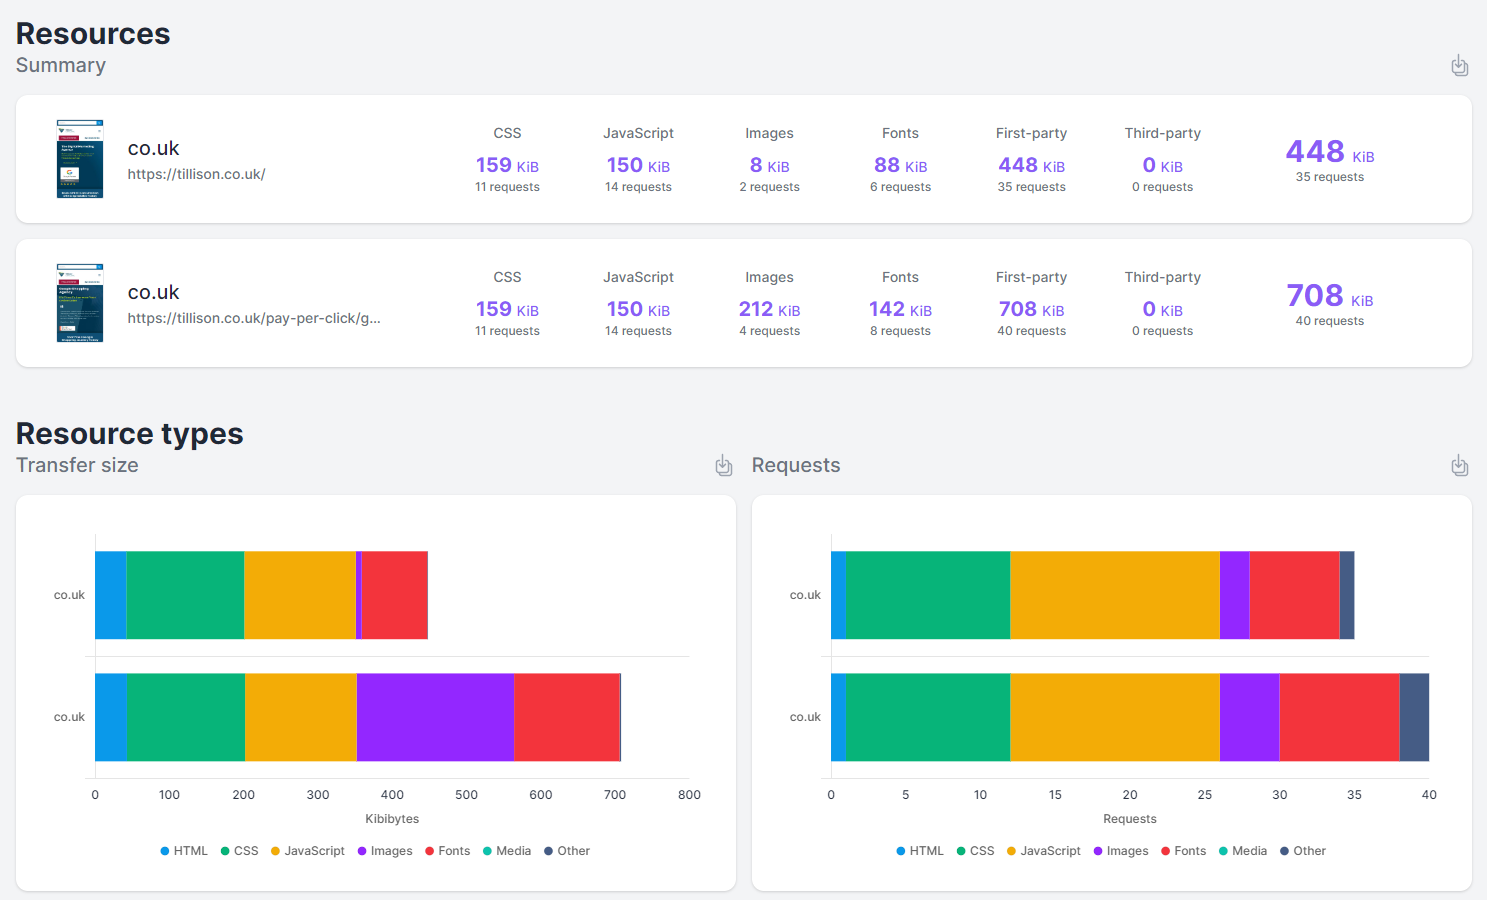
Page Speed Compare is a really neat tool that will compare multiple pages at once. Great for comparing multiple pages on your own site, or benchmarking your pagespeeds against competitors.
Price: Free
User level: Web Admin / Developer
Pagespeed.compare features include:
Comparison of multiple URLs: You can enter the URLs of two or more web pages and compare their performance side by side.
Detailed performance metrics: Pagespeed.compare provides a detailed breakdown of the performance of each web page, including loading time, page size, number of requests, and other metrics.
Performance recommendations: Based on the analysis of each web page, Pagespeed.compare provides recommendations for improving performance and speeding up the loading time.
Visual comparison: Pagespeed.compare provides a visual comparison of each web page, allowing you to see how they differ in terms of layout, content, and other factors.
Historical data: Pagespeed.compare allows you to compare the performance of the same web page over time, providing insight into how changes to the page affect its loading speed and performance.
6. Lighthouse
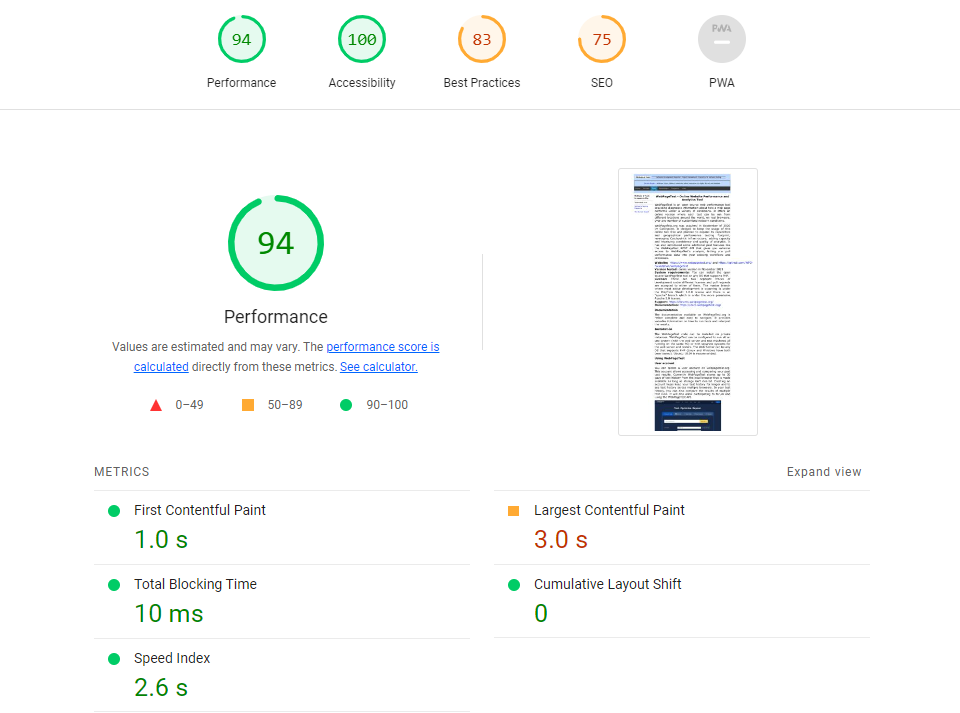
Lighthouse is a free tool built into the Chrome browser that provides recommendations for improving the performance, accessibility, and SEO of web pages.
Price: Free
User level: Developer
Lighthouse features include:
Performance auditing: Lighthouse analyses the performance of web pages, including their loading speed, time to interact, and other metrics, and provides recommendations for improving performance.
Accessibility auditing: Lighthouse checks web pages for accessibility issues and provides recommendations for improving accessibility for users with disabilities.
Best practices auditing: Lighthouse checks web pages against best practices for web development, including security, mobile responsiveness, and other factors.
SEO auditing: Lighthouse analyses web pages for search engine optimisation (SEO) issues, such as metadata, headings, and other factors that affect search engine rankings.
Progressive web app auditing: Lighthouse checks web pages against the criteria for progressive web apps, including offline functionality, fast loading times, and other factors.
Reporting and tracking: Lighthouse generates reports for each audit and allows you to track changes in performance over time.
7. SpeedCurve
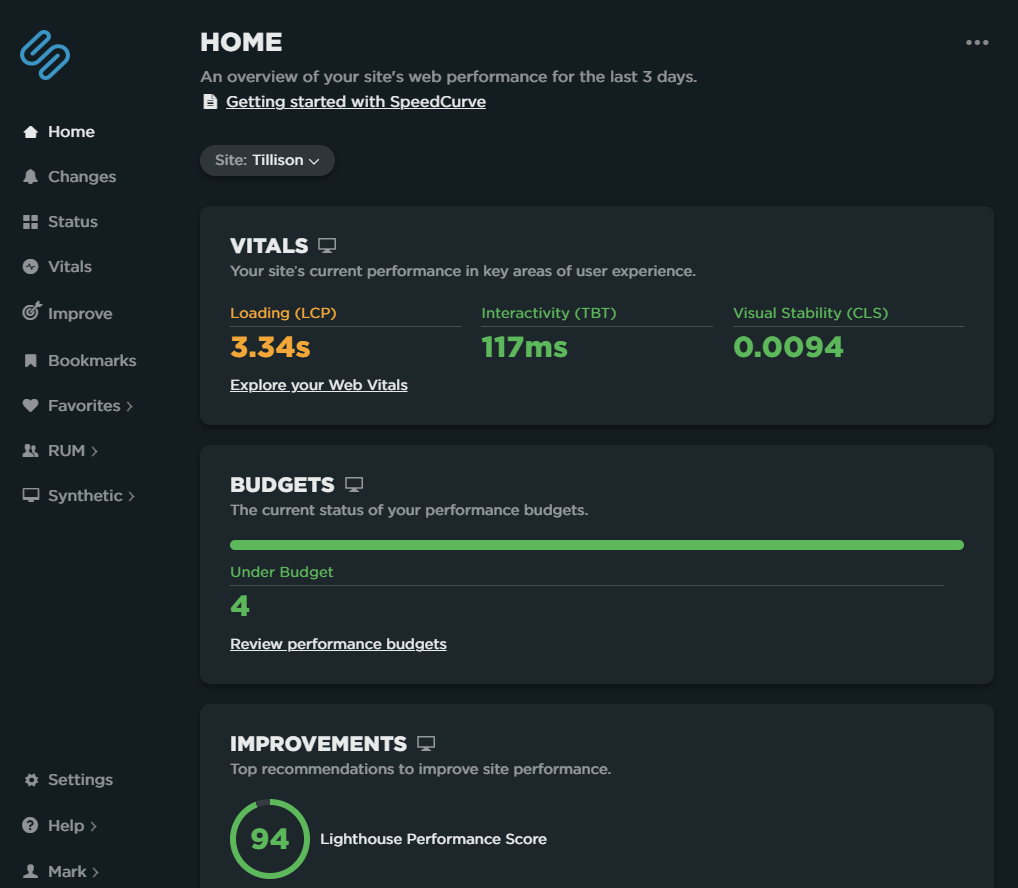
SpeedCurve is a paid tool that provides continuous monitoring and optimisation of website performance.
Price: From $12/month
User level: Developer
SpeedCurve features include:
Synthetic monitoring: This feature allows users to track website performance from various locations around the world and on different devices.
Real user monitoring: This feature enables users to collect performance data from real users and identify issues that may affect their experience.
Continuous monitoring: This feature enables users to track website performance over time and receive alerts when issues arise.
Waterfall charts: SpeedCurve provides visual representations of the network requests and assets that are loaded when a page is accessed, helping users identify performance bottlenecks.
Performance budgets: This feature allows users to set performance targets for their websites and monitor performance against these targets.
Third-party monitoring: SpeedCurve enables users to track the performance of third-party scripts and services that are used on their websites.
Asset tracking: This feature allows users to track the size and performance of individual assets on their website.
Collaboration: SpeedCurve enables users to share performance data and collaborate with team members and stakeholders.
8. Uptrends
Uptrends is a paid tool that provides website and server monitoring, including website speed testing and performance analysis.
Price: From <£10/month
User level: Developer
Uptrends features include:
Website monitoring: Uptrends checks your website’s uptime, response time, and other critical metrics to ensure that your site is running smoothly.
Server monitoring: Uptrends monitors your servers for issues such as high CPU usage, low disk space, and other server-related problems.
Transaction monitoring: Uptrends checks the availability and performance of complex transactions on your website, such as login forms and shopping carts.
Synthetic monitoring: Uptrends simulates user interactions with your website to test its performance and functionality.
Real user monitoring: Uptrends tracks real user interactions with your website, allowing you to identify performance issues and improve the user experience.
Mobile app monitoring: Uptrends monitors the performance of your mobile apps, including load times and functionality.
API monitoring: Uptrends checks the availability and performance of your APIs, allowing you to identify issues before they impact your users.
Performance testing: Uptrends allows you to test the performance of your website or application under different load conditions.
Reporting and analytics: Uptrends provides detailed reports and analytics to help you identify performance issues and track improvements over time.