Core Web Vital reports are an essential tool for measuring the health of a website. CWV reports allow us to understand how users experience our site from a technical standpoint such as page loading performance. User experience has become a major ranking signal to search engines, and so this article is to give readers a general understanding of Core Web Vitals and how to accurately interpret them, allowing you to improve them.
What are the Core Web Vitals?
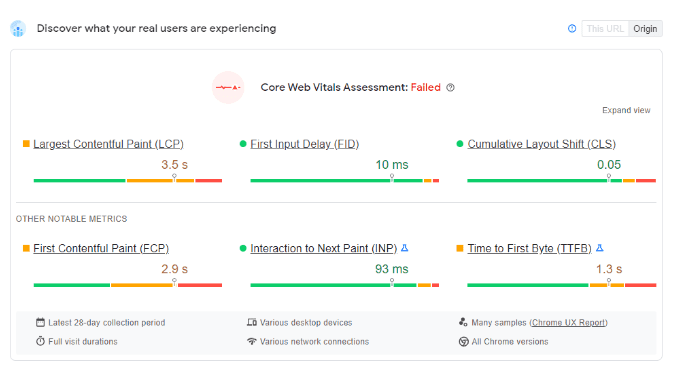
Google’s Core Web Vitals are a set of measurable web vitals that are good indicators of page experience. The metrics that make up the Core Web Vitals will evolve as Google acknowledges that they are not perfect and that we should expect improvements or addition in the future. However, what we do know for now is that there are three definitive Core Web Vitals.
Largest contentful paint
This is a measure of loading performance or ‘perceived load speed’ – how quickly a page can load and render all of its visual elements to the screen. The largest contentful paint (LCP) reports the amount of time it takes for the largest image or block of text to be visible within the viewport.
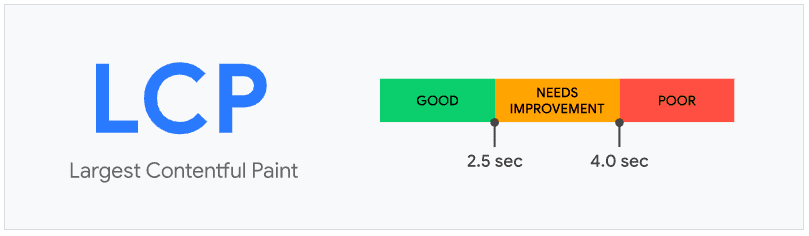
For a page to provide a good user experience, the LCP should be below 2.5 seconds. Anything above this needs to be improved, and anything above four seconds is considered poor.
First input delay
The first input delay (FID) measures load responsiveness – how quickly a page responds to the user clicking on a link or button or using any JavaScript-powered control. It doesn’t take into account actions such as scrolling or zooming (these are evaluated separately).
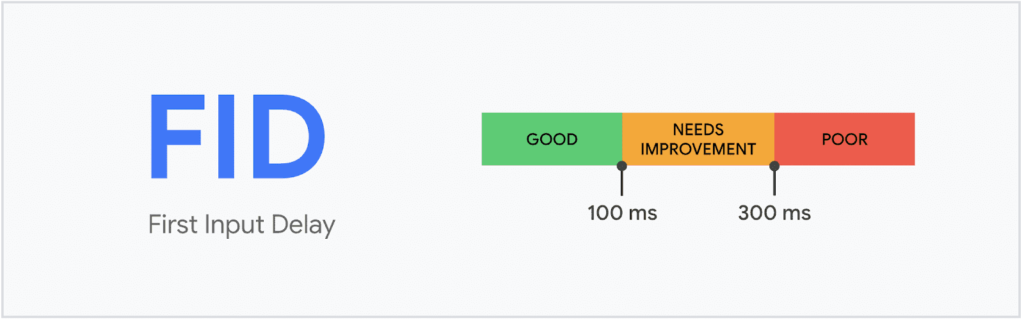
To ensure that you’re providing a good user experience, the page should have an FID of less than 100 milliseconds (ms) – anything over 300 ms is considered to be poor.
Cumulative layout shift
This is a measure of visual stability. It helps to quantify how often users experience expected layout shifts. An example of this would be when the text suddenly moves or when you are about to click a button and the link moves.
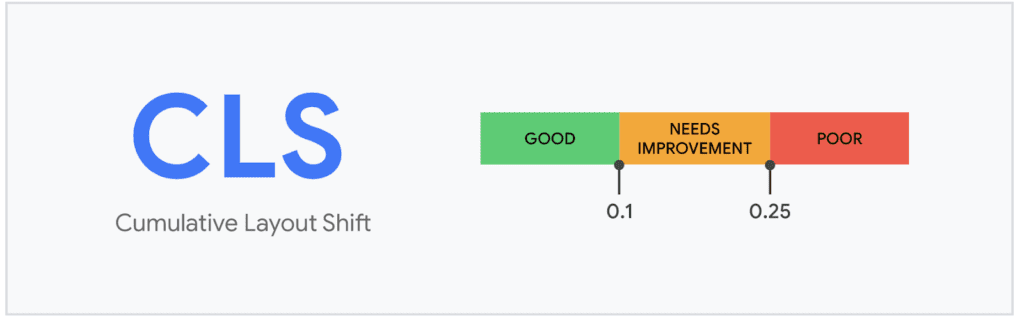
Pages should strive to have a cumulative layout shift (CLS) score of less than 0.1 in order to provide a good user experience. Anything above needs improvement – a score over 0.25 is considered to be poor.
First Contentful Paint
First contentful paint looks at your page’s content, more specifically it measures the time in which it takes said content to render after a user accesses your page. When we are talking about content we are referring to text, videos, <svg> elements, non-white <canvas> elements and images, which also include any background images.
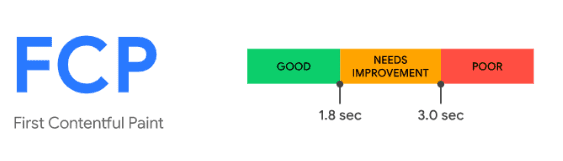
In terms of First Contentful Paint, it is considered that for a good user experience you should aim for 1.8 seconds or less and that anywhere after 3.0 seconds is considered poor.
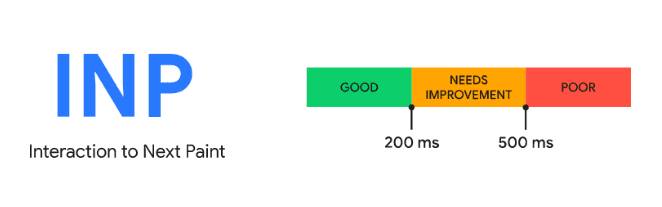
Interaction to Next Paint
Interaction to Next Paint is only considered an experimental metric, but it evaluates the page’s responsiveness by recording any latency issues that a user may experience whilst interacting with a particular page.
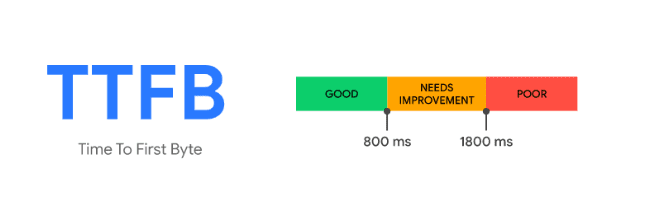
Time to First Byte
Time to First Byte is a metric that measures connection setup time and web server responsiveness, it measures the time between a request such as a redirect and the time it takes for the first byte to respond to the request. This essentially helps to determine if a web server is too slow to respond to requests.
How can you measure the Core Web Vitals?
With the Core Web Vitals having such a huge role in user experience and search rankings, Google has to display them somehow. Luckily there are several tools that make it easier for site owners to measure them.
Lab Tools
Tools that provide insight into how your potential users may experience your website are called lab tools. Tests are carried out in a controlled environment, hence the reference to laboratories. Lab tools are effective in measuring LCP and CLS but cannot be used to measure FID.
Instead,
it is recommended to take note of the total blocking time or TBT. This is because most performance optimisations for TBT also work for FID. Exactly like the Core Web Vitals, the score of the TBT is colour-coded green, orange or red – anything lower than 300 ms is considered good, readings above need improvement and anything more than 600 ms is considered poor.
Chrome DevTools
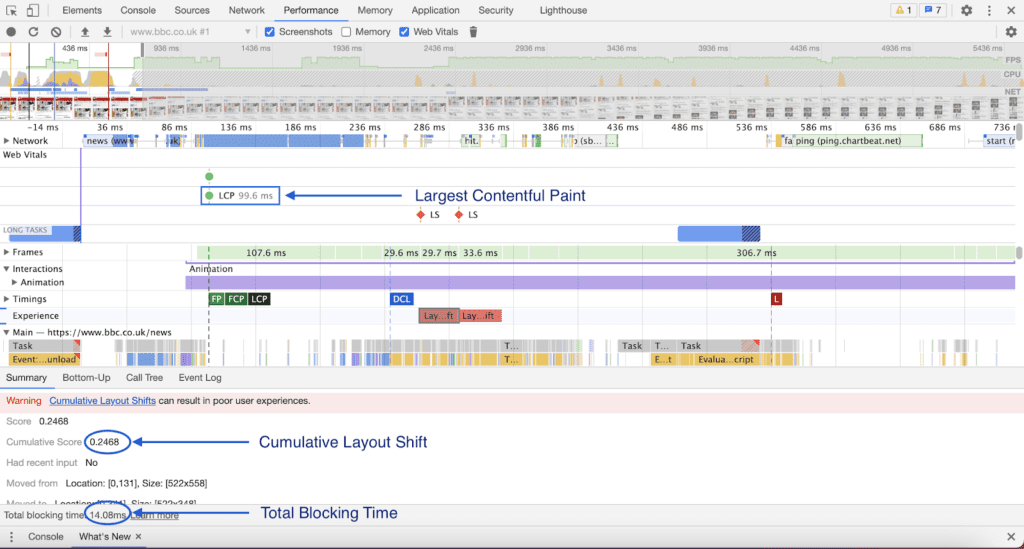
Chrome DevTools is built directly into the Google Chrome web browser. This can be brought up by right-clicking on a webpage, selecting ‘inspect’ and then opening the ‘Performance’ tab.
Web Vitals has its own reporting lane within the tool. Each vital is colour-coded based on how it is performing – green if it has passed and red if it needs improving.
Below you can see a brief report from the BBC News website. To somebody relatively new to this tool it may seem rather daunting but when you break it down, but it’s actually rather easy to read. In the Web Vitals lane, you can see LCP and layout shift – LCP is coded green as it is below the 2.5-second threshold. However, the layout shift is displayed in red, showing room for improvement.
By clicking on the layout shift-tab in the Experience lane, a summary will be displayed showing the CLS score and a warning by Google.
You will also notice at the bottom of the report the TBT is displayed – giving you a good indicator of FID.
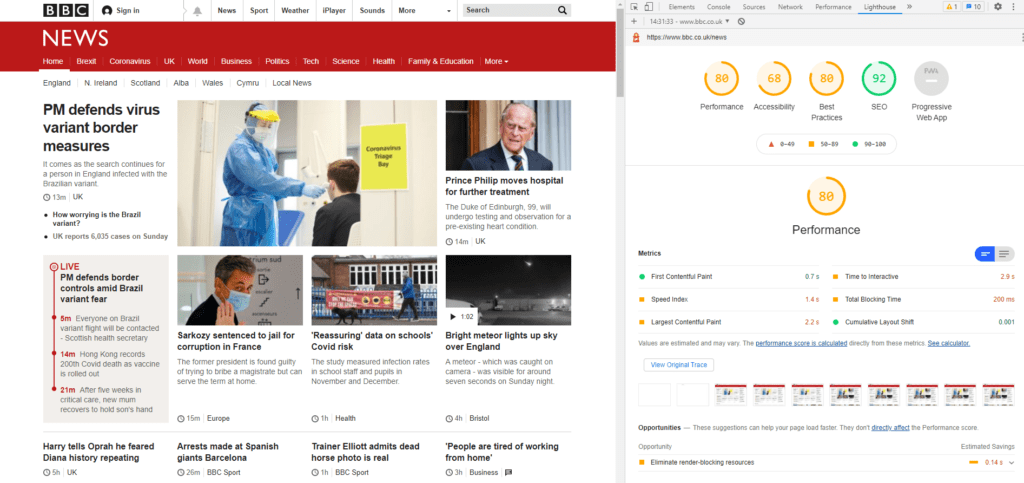
Lighthouse
Lighthouse can be opened in the same way – instead by selecting the ‘Lighthouse’ tab. Lighthouse benefits from a slightly clearer, more user-friendly interface. It gives scores on the page’s performance, accessibility, best practices and SEO.
Under ‘Performance’ you will see a set of metrics displayed, including two of the Core Web Vitals – LCP and CLS – as well as TBT. Lighthouse also offers up diagnostics and opportunities for where you can improve the page’s performance.
Field Tools
Field tools give performance-related scores based on how real users are experiencing your web page. These tools are great for measuring each of the three Google Core Web Vitals – including FID, unlike the lab tools.
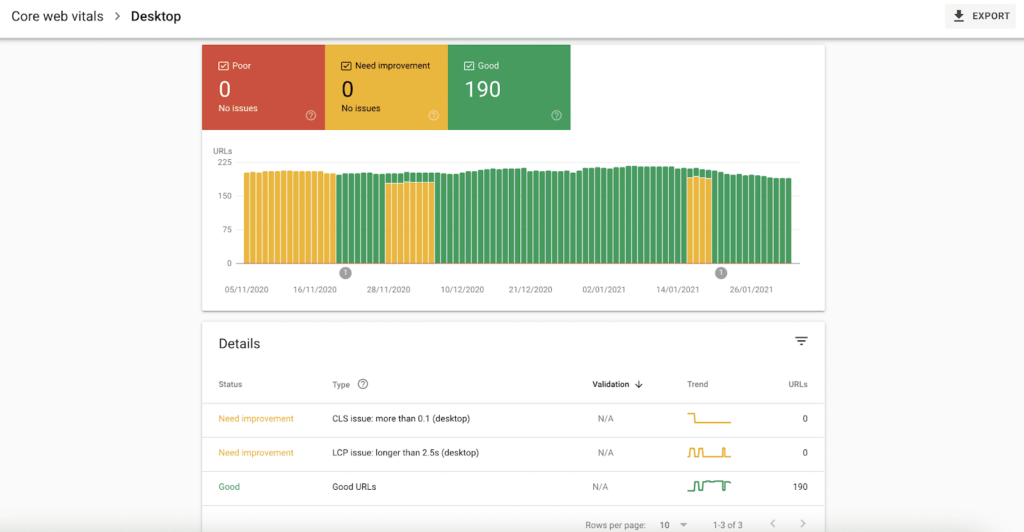
Chrome User Experience Report
The Chrome User Experience Report (CrUX), has collected data on user experience from millions of websites. CrUX has a dedicated Core Web Vitals landing page breaking down each metric into mobile and desktop. You can create your report within Google Data Studio.
PageSpeed Insights
PageSpeed Insights is capable of measuring both lab data and field data as it incorporates Lighthouse. The Core Web Vitals are marked with a blue ribbon, and the report will tell you if your page passes the assessment. Like Lighthouse, it provides you with feedback that you can action in order to improve user experience.
Search Console
Google Search Console (GSC) is a fantastic tool for measuring URL performance across an entire website. Here you can see the top performing pages based on clicks and impressions, check for mobile usability and inspect specific URLs. What’s more, is that GSC has a tab dedicated to the Core Web Vitals. It colour codes URLs based on how they’re performing, and raises issues for URLs that need improvement or are considered poor.
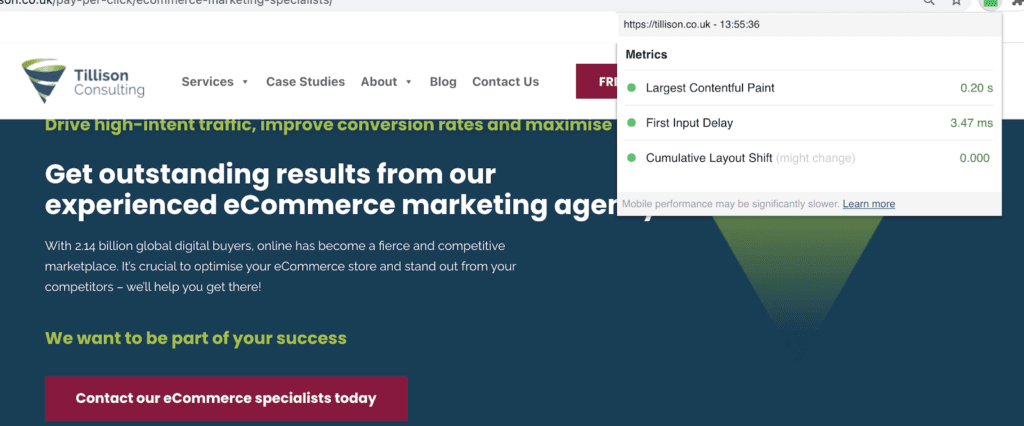
Chrome extension
Available in the Chrome Web Store, you can install a Web Vitals extension that provides you with the metrics in real-time.
Web Vitals JavaScript library
Google has launched its web vitals JavaScript library. By configuring your site to use this, you can have all of your Core Web Vitals data sent directly to your Google Analytics.
Improving Google Core Web Vitals
There are many reasons why you may be recording poor Core Web Vitals scores. As mentioned, tools such as Lighthouse provide you with actionable feedback to go about improving your user experience. However, there are a few things you can do to avoid a poor user experience.
Improving the largest contentful paint
One common cause of a poor LCP time is by having a slow server response time. Therefore, it is important to optimise your server.
However, if this isn’t possible, it is worth optimising the size of your image files – especially those within the viewport. WebP is a format that has become increasingly popular as web developers look toward improving user experience. Try to eliminate images above the fold on mobile where you can so that the page displays just text within the initial viewport.
Improving first input delay
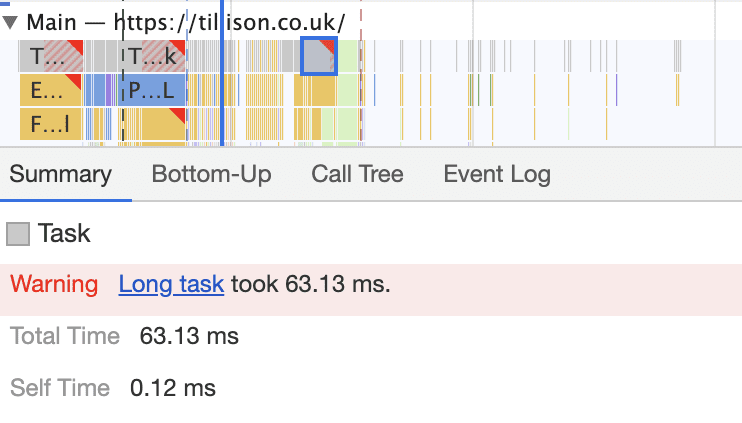
Long tasks are a leading contributor to poor FID time. Google recommends that all tasks run at less than 50 ms and that large pieces of script will inevitably lead to Long Tasks. Therefore these have to be optimised.
Chrome DevTools will display any long tasks like in the example below. As is Google’s recommendation, the large piece of script that causes this Long Task of 63.13 ms will have to be broken up into smaller chunks.
Improving cumulative layout shift
The annoying issue of a page moving around after the user thinks it has loaded is due to it not reserving enough space for images. For any images that are to load in, you will need to ensure that a block to its dimensions is reserved and fits the layout of the page. Without this, an image can simply load in and knock other pieces of content around the page – frustrating the user.
Summary
Core Web Vitals are ranking signals and it is crucial for you to be prepared, in order for you to improve your search rankings. You will need to take note of your current Core Web Vitals scores and action any improvements that must be made. Google’s John Mueller stated that all three vitals must be met in order for a page to benefit from higher rankings. So it is not simply a case of improving one while neglecting another. So are you ready to improve your ranking signals?